
Live sales dashboard
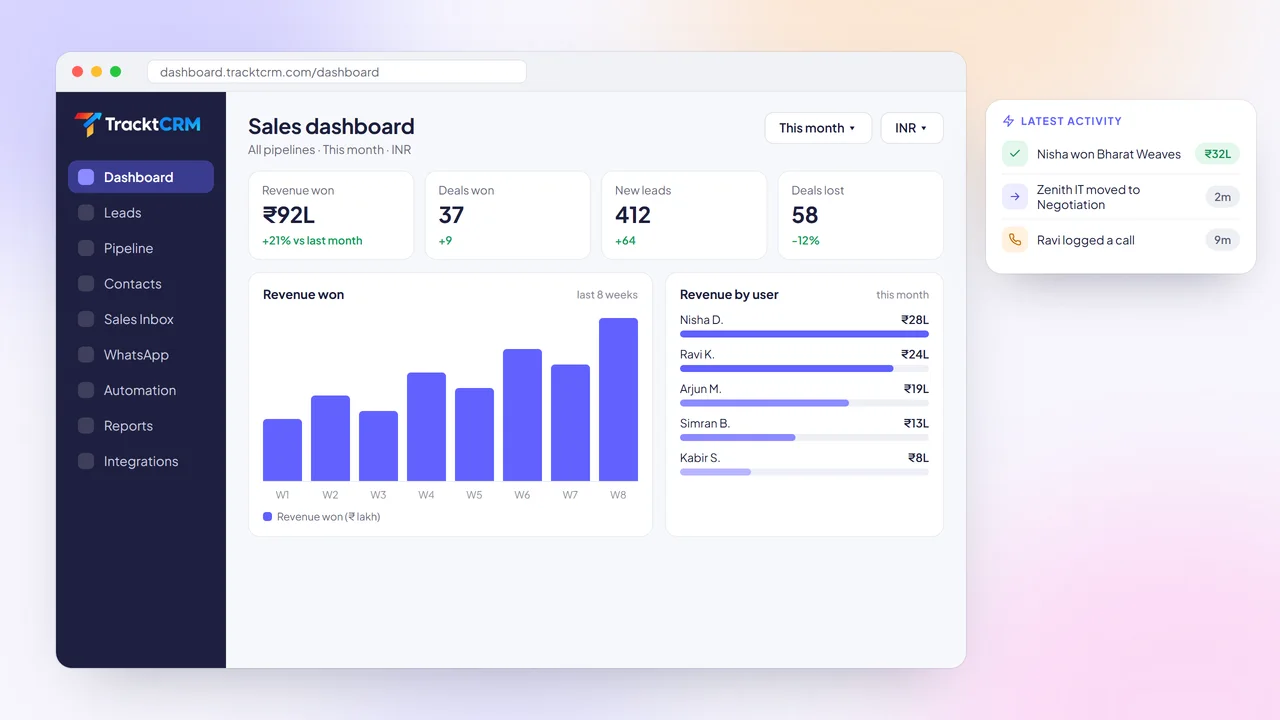
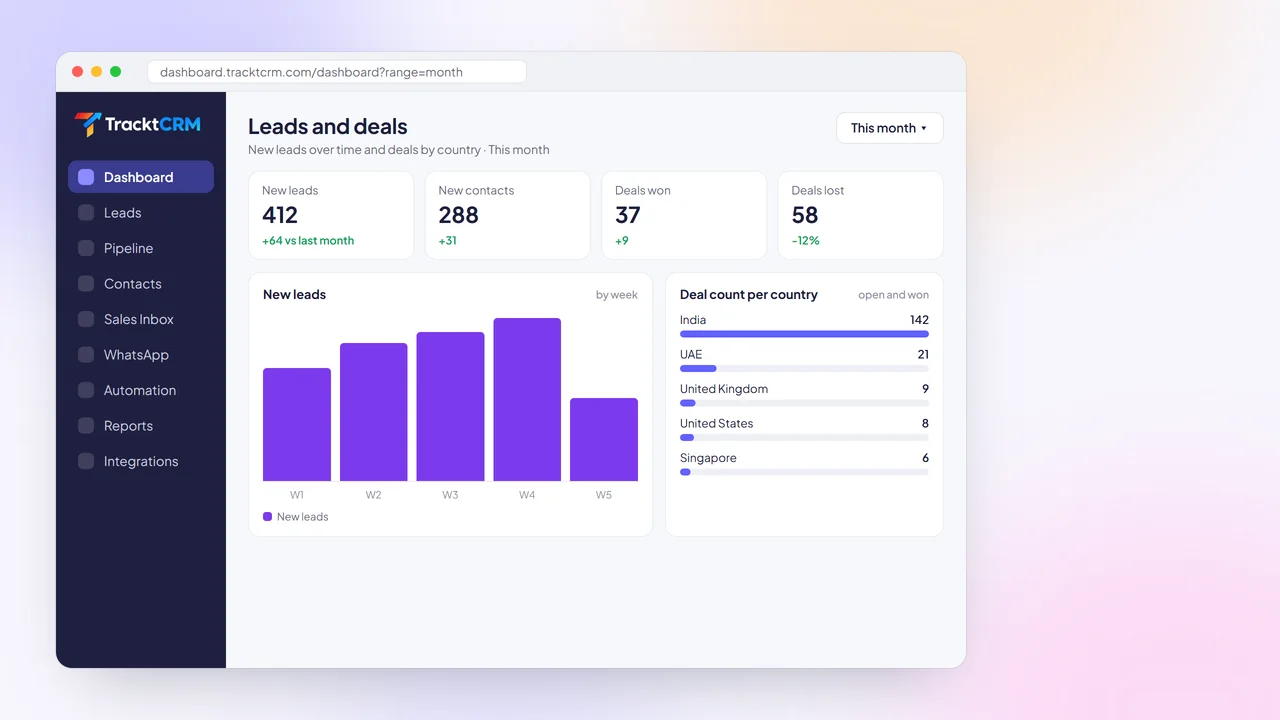
Revenue won, deals won and lost, new leads and contacts, each compared with the previous period.
THE BASICS
CRM reporting turns the deals, leads and activities in your CRM into numbers you can act on: how much you won, how many deals you lost and why, and which reps are closing.
Because the data comes from the CRM itself, reports stay up to date without anyone exporting, cleaning and pasting spreadsheets every Friday.
FEATURES
The numbers managers ask for most, ready from the first day and updated as your team works.
Revenue won, deals won and lost, new leads and contacts, each compared with the previous period.
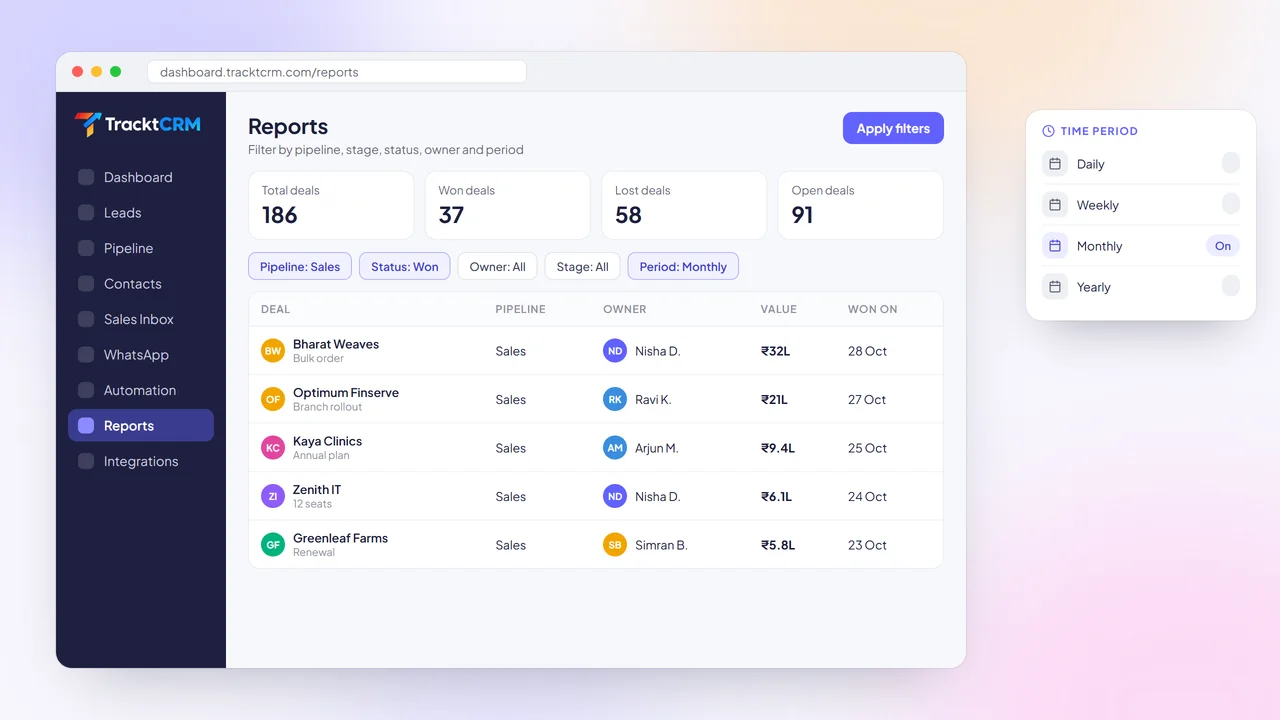
Filter deals by pipeline, stage, status and owner, for daily, weekly, monthly or yearly periods.
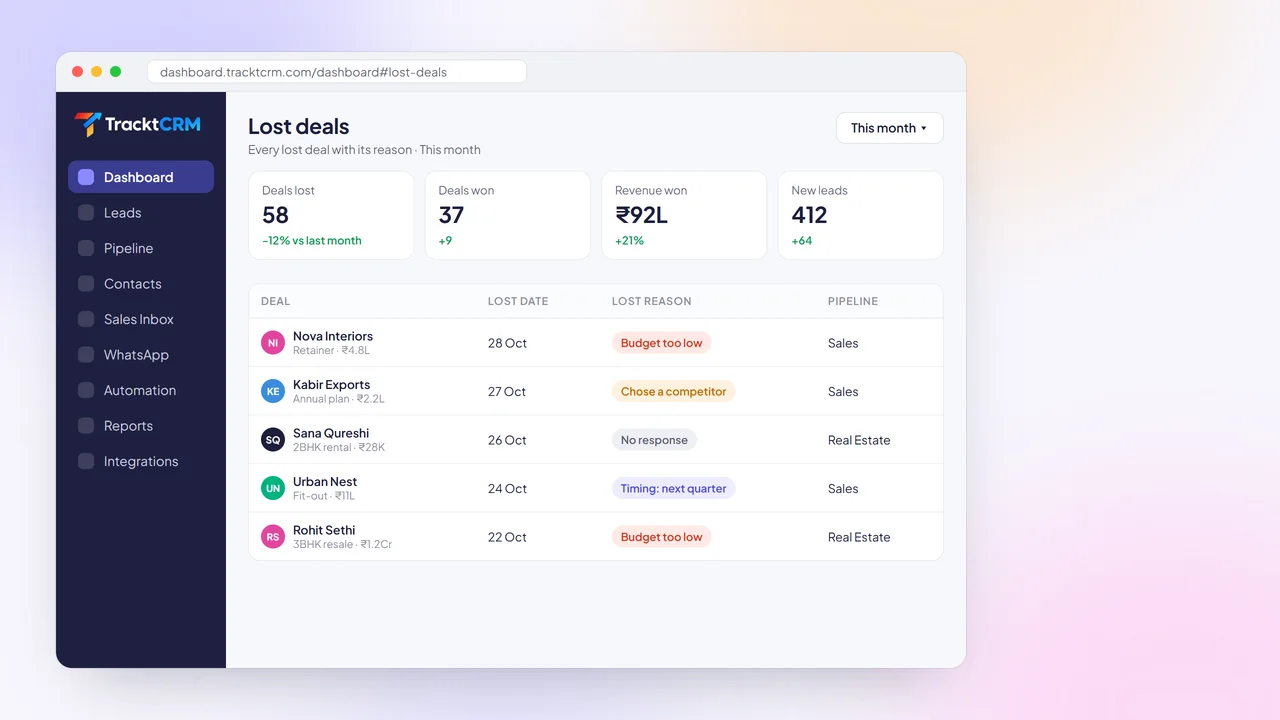
Every lost deal keeps its lost reason, date and pipeline, so patterns are easy to spot.
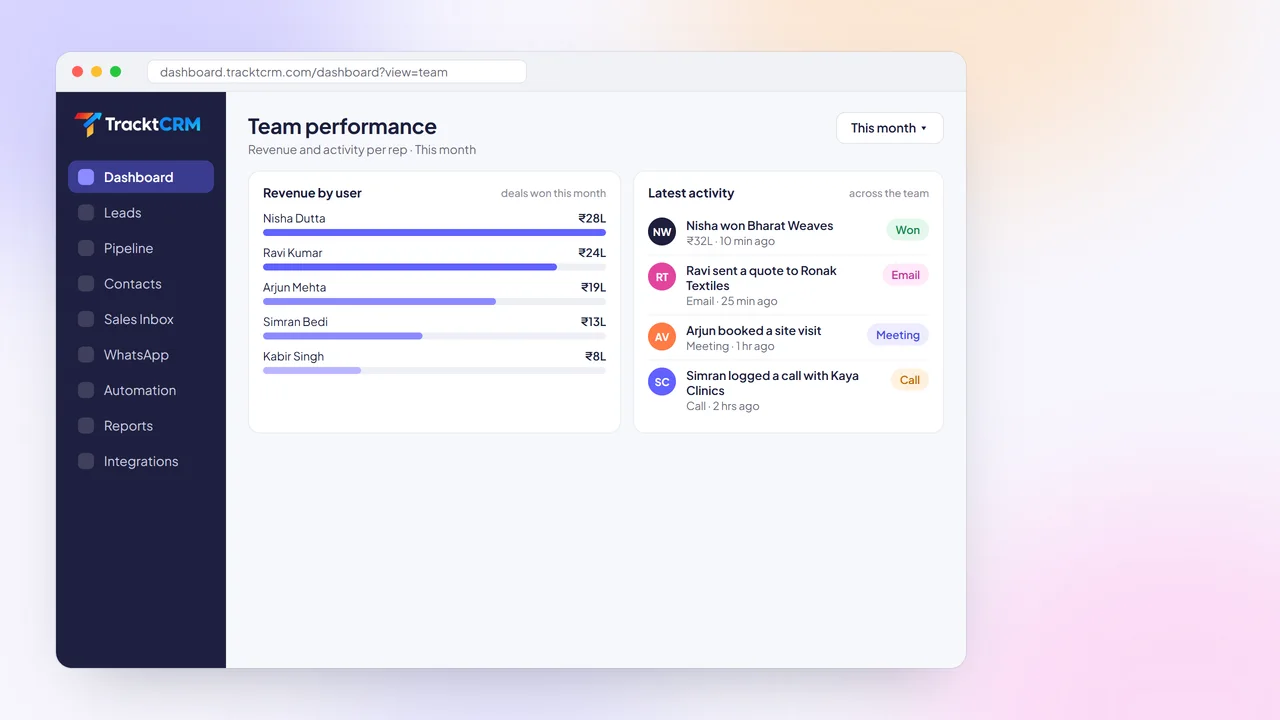
See how much each rep has won in the selected period, side by side.
Charts of revenue won and new leads show whether the month is heading up or down.
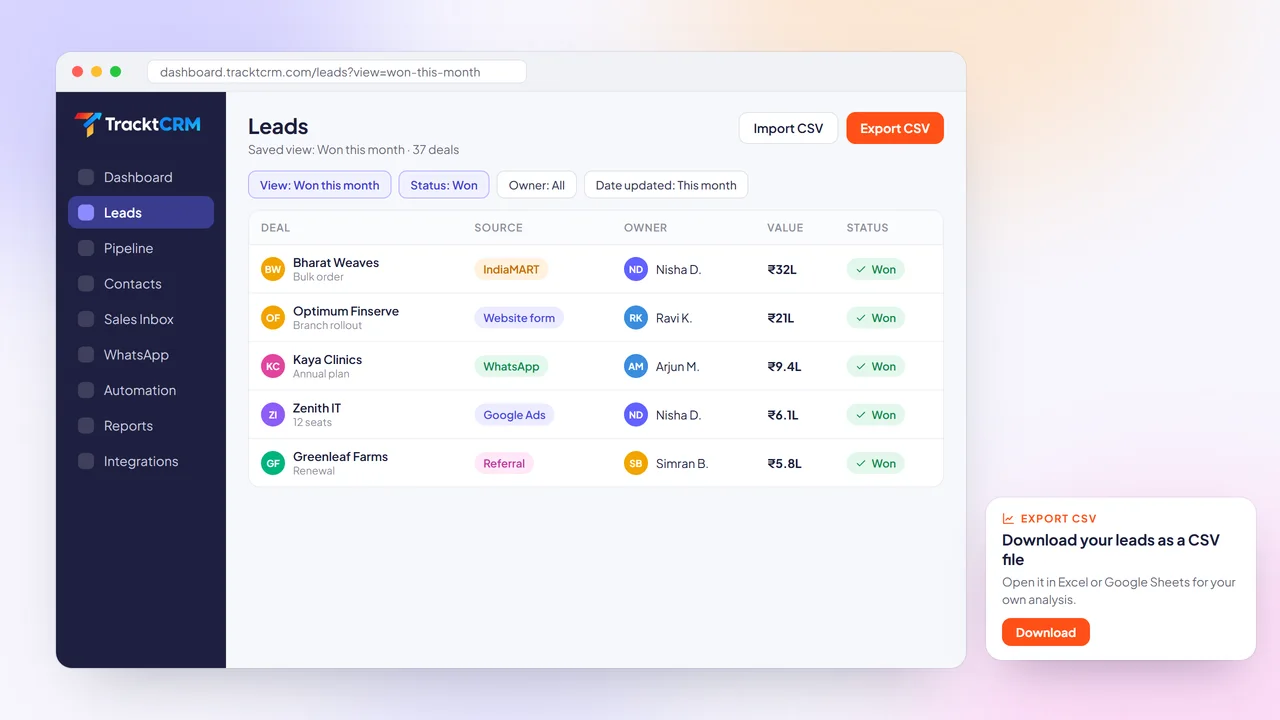
Export leads, contacts, organisations and products to CSV for your own analysis.
BUYER'S GUIDE
Good sales reporting saves time every week. Check for these before you choose.
Reports should update as reps move deals, not after someone remembers to refresh a spreadsheet.
Pipeline, stage, owner and period filters answer most questions without building a custom report.
Knowing why deals are lost matters as much as knowing how many you won.
Revenue per rep and recent activity help managers coach the right person.
Comparing this month with last month shows whether things are improving.
Roles and permissions decide who can view reports, so sensitive numbers stay with the right people.
SALES REPORTS
Most questions a manager asks sound like this: how many deals did we win in this pipeline this month, and how many are still open?
The Reports page in TracktCRM answers them with simple filters. Choose a pipeline, stage, status and owner, pick a daily, weekly, monthly or yearly period, and see total, won, lost and open deal counts with the list of deals behind them.
Because reports read the same data your team updates, there is nothing to export or reconcile.
LOST DEAL ANALYSIS
Every team loses deals. The teams that improve are the ones that know why.
When a deal is marked lost in TracktCRM, the rep picks a lost reason from your list. The dashboard shows how many deals were lost compared with the last period, and opens the full list of lost deals with each date, reason and pipeline.
If most deals are lost on budget, look at pricing. If they are lost to no response, tighten your follow-up workflows.
TEAM PERFORMANCE
A team total hides a lot. One rep may be carrying the month while another needs help.
Revenue by user on the TracktCRM dashboard shows how much each rep has won in the selected period. The latest activity feed shows what is happening across the team as it happens.
Filter reports by owner to see any rep's won, lost and open deals before your next one-to-one.
TRENDS
Waiting for month-end to see results leaves no time to change them.
The dashboard charts new leads and revenue won over time, compares each number with the previous period and counts deals per country. Switch between today, this week, this month, this year or a custom date range.
A drop in new leads in week two is a signal to act in week three, not a surprise at month-end.
EXPORT
Sometimes you need the raw data, for a board deck, an accountant or your own pivot table.
Export leads from TracktCRM to a CSV file with their owner, source, value and status, and open it in Excel or Google Sheets. Contacts, organisations and products can be exported too.
Your data is always yours to take with you.
INTEGRATIONS
Leads from WhatsApp, ads, portals and forms, and activity from Gmail and Google Calendar, all feed the same reports.
 WhatsApp
 Gmail
 Google Calendar
 Meta Lead Ads
 Google Ads
 IndiaMART
 Justdial
 99acres
 Housing.com
 Shopify
 Razorpay
 Webhooks
WORKS WELL WITH
Reports are only as good as the data behind them. These features keep it complete.
Learn how a live sales dashboard helps managers see the pipeline at a glance.
Clear stages and lost reasons give your reports something useful to measure.
Workflows log follow-ups and activities automatically, so reports reflect real work.
FAQ
CRM reporting turns the deals, leads and activities stored in your CRM into reports such as revenue won, deals won and lost, lost reasons and revenue per rep. Because the data comes from the CRM, reports stay current without manual spreadsheets.
The dashboard shows revenue won, revenue by user, deals won and lost, new leads and contacts, deal count per country, lost deals with reasons and the latest activity. The Reports page lists deals filtered by pipeline, stage, status, owner and period.
Yes. Filter reports by pipeline, stage, status and owner, and choose a daily, weekly, monthly or yearly period. The dashboard can be set to today, this week, this month, this year or a custom date range.
When a deal is marked lost, the rep chooses a lost reason. The dashboard lists every lost deal with its date, reason and pipeline, so you can see the most common reasons.
Yes. You can export leads, contacts, organisations and products to CSV files and open them in Excel or Google Sheets.
This page covers every report and analytics feature in TracktCRM. The sales dashboard page focuses on how managers use the live dashboard to watch the pipeline day to day.
MORE FEATURES
Start tracking revenue, lost reasons and rep performance today. Free plan for 1 user, no credit card needed.